High-Throughput CRISPR Screening & Analysis
Biotechnology Laboratory Final Presentation
Year
2023
University of California San Diego
La Jolla, California
Simplistic Analysis
vs
MAGeCK Analysis
HeLa Cells
vs
MDA-MB-231 Cells

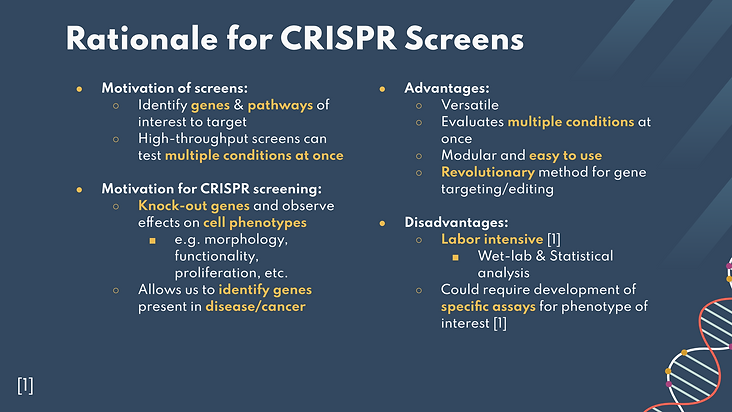
CRISPR screens are a highly effective tool that allow us to identify the genes and cellular (signaling) pathways that affect various healthy and diseased cell conditions. By definition, the high throughput screens allow us to test multiple conditions simultaneously.
Using CRISPR to knock out genes allows us to observe the effect of a lack of genes on various cell phenotypes, from morphology to function to growth, allowing us to correlate these genes to various diseases, such as cancer, autoimmune diseases, and more.
Some of the advantages of CRISPR screens are that it is highly versatile, allowing us to evaluate multiple conditions at once, speeding up the process it takes to observe gene function. CRISPR is modular and easy to use compared to other genetic editing techniques, as the use of optimizable and specific sgRNAs allows us to target multiple genes in a high-throughput manner. For these reasons, the discovery of CRISPR has been a revolutionary development in genetic engineering.
However, there are a few minor disadvantages to using a high-throughput CRISPR screen. In the lab, creating the high-throughput experimental platform can be labor-intensive and can require the development of specific assays to study phenotypes of interest. In industry, these disadvantages have been mitigated by the use of automated liquid handling systems, such as pipetting robots and echo liquid handlers, that are capable of transferring solutions to and from millions of wells in millions of plates.
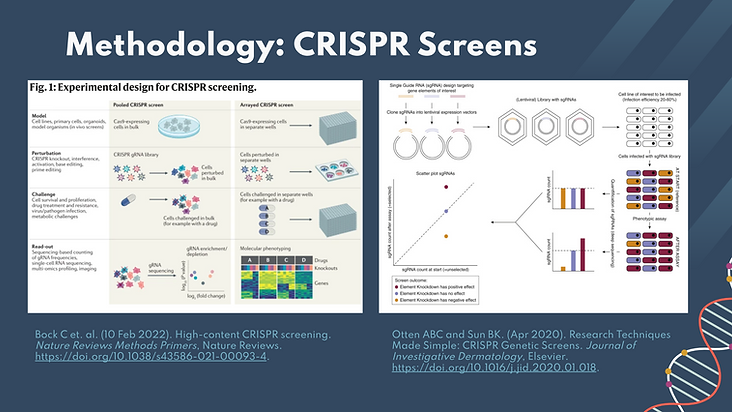
These images depict the process typically used for CRISPR screening. The first step requires the development of CRISPR/Cas9/sgRNA expressing cells using lentiviral transduction techniques. In our experiment, we used a pooled method where the cells are grown in bulk, as compared to the arrayed method, commonly used in industry, where the cells are grown in individual wells. The next step is to perturb the cells by treating them with the desired condition which was the CRISPR knockouts in our case. For our analysis, we engineered multiple replicates for each gene by having 3 or 4 sgRNAs with the same gene target. This was beneficial in decreasing the experimental noise, but it could have also decreased the intensity of the signal we received.
The selection factor is then applied to the cells. Cells are observed before and after the selection pressure is observed in order to determine the effects of the selection pressure on the desired condition (cell morphology, functionality, growth, etc.). In this work, the selection pressure is the knockout of a specific gene.
Finally, we analyze the cells before and after the selection pressure. For observing effects of gene knockouton cell growth, we used wet-lab techniques, such as NGS cloning and sequencing to isolate and amplify sgRNAs from the genomes of the surviving cells. We then used sgRNA counts and correlated this to the number of cells that survived the selection pressure. This describes the work we did in this lab.
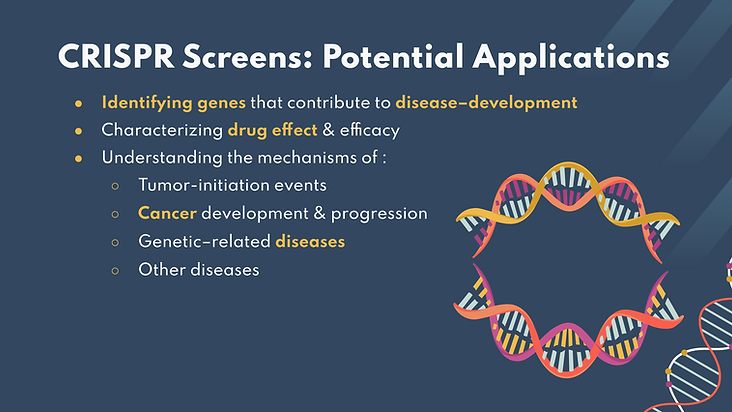
CRISPR screens can be used for multiple purposes and applications in both lab and industry settings. One of the major uses of CRISPR screens in industry is to characterize the effect and efficacy of drugs that have been developed to treat diseases, such as cancer. It is very commonly used in industry to both identify potential small-molecule drugs and test how much of the drug would be needed to successfully treat the disease or cancer. In research development settings in both industry and labs, CRISPR can also be used to analyze the underlying mechanisms that drive the development of genetic-related diseases, specifically those involved in tumor-initiation events.
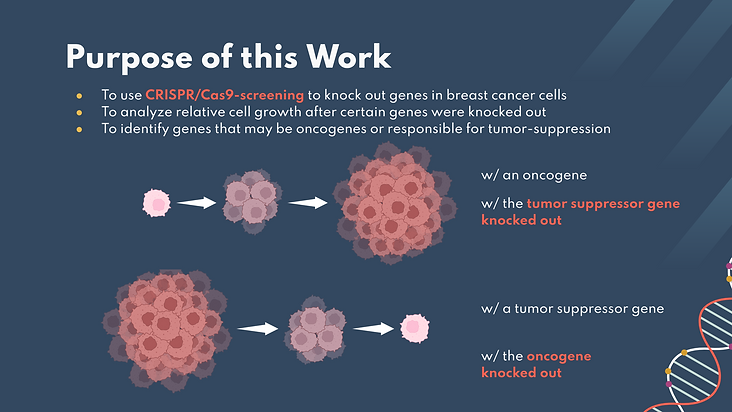
In this work, we use CRISPR-Cas9 screening to knock out certain genes in the breast cancer cell (MDA-MB-231 cells model triple-negative breast cancer) kinome and analyze the relative cell growth after this knockout. The ultimate purpose of this was to begin looking into which genes in cancer cells might be oncogenes or tumor-suppressors. This was further researched by analyzing HeLa cervical cancer cell genomes to compare potential genes of interest.
In native tissues, oncogenes are genes that initiate cancer development while tumor suppressors limit cell growth, limiting the development of tumors. In our work, since we are using knockout techniques, if we observed an increase in cell growth, this means the gene knocked out could be a tumor suppressor. Vice versa, if we observed a decrease in cell growth, this means the gene knocked out could be an oncogene. If we are able to successfully identify oncogenes, future works could build upon this research by developing drugs that target our identified potential oncogenes.

Our methodology to mathematically analyze the genetic screening involved two methods. Our first method of genetic screening was using a simplistic analysis to calculate the gene scores and z-scores to identify which genetic components had the most impact on cell growth after transfection with our CRISPR complex. We received the sgRNA counts from NGS sequencing and proceeded to add 1 to each count to avoid any logarithmic errors in case there were zero values. Then, we calculated the fractional abundance on a log2 scale since it considers the proportional change in exponential cell growth due to cell doubling. The overall fold change was determined by subtracting the fractional abundances on day 3 from day 14, which measures the up-regulated and down-regulated genes between samples. The average fold change values determined the individual gene scores which were used to calculate the z-scores of each gene. These scores are a measure of how many standard deviations below or above the population mean a raw score is and indicates the difference in expression levels. The cutoff for significant genes was an absolute z-score of above 3, where a negative score corresponds to reduced cell growth, indicating the gene knocked out was an oncogene. In contrast, a positive score suggests increased growth, meaning the gene knockout corresponds to a tumor suppressor.
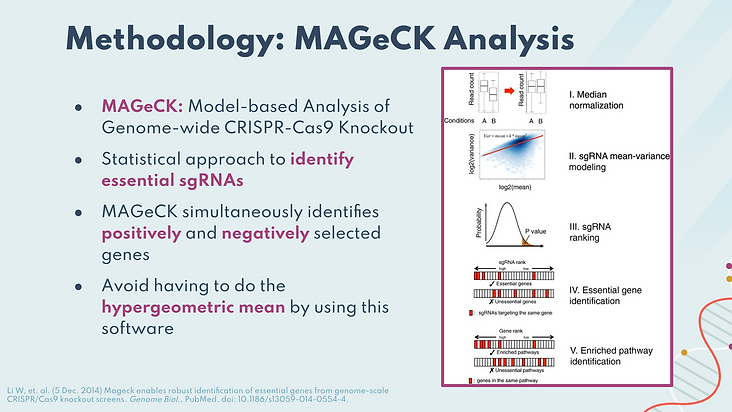
The second method we used for mathematical analysis was MAGeCK. We used this method to develop analysis for genome-wide assessment. MAGeCK stands for model-based analysis of genome-wide CRISPR-CAs9 knockout and is a software used as a statistical method to rank sgRNAs and help us identify significant genes and enriched pathways. It is highly advantageous compared to simplistic analysis as it avoids manual calculations such as the hypergeometric mean and is able to simultaneously identify positively and negatively significant genes. We identify significance based on the z-score per genes as previously described.
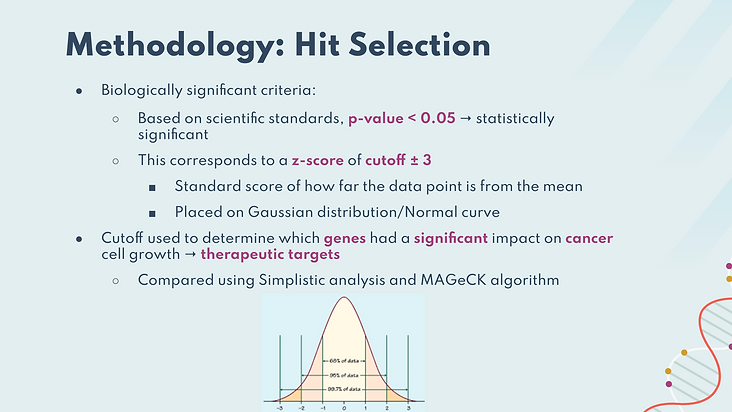
To identify significance based on these analyses, we graphed calculated z-scores on a Gaussian distribution/normal curve. Based on scientific standards, we chose a z-score cutoff of ± 3. If a gene had an absolute value z-score greater than 3, then the affected growth of the cells based on those genes are at least 3 StDevs from mean, which corresponds to p-value < 0.05.
The p-value describes how likely a particular set of observations is to be found if the null hypothesis could be accepted. In this case, the null hypothesis is the event that knockouts do not have an effect on cell growth. Identified gene hits had a significant impact on cancer cell growth, confirming their biological relevance. These would be considered as potential therapeutic targets. We then compared hits found using Simplistic analysis and the MAGeCK algorithm to assess whether these methods of analysis would yield significantly different results.
Here we present the results of our experiments.
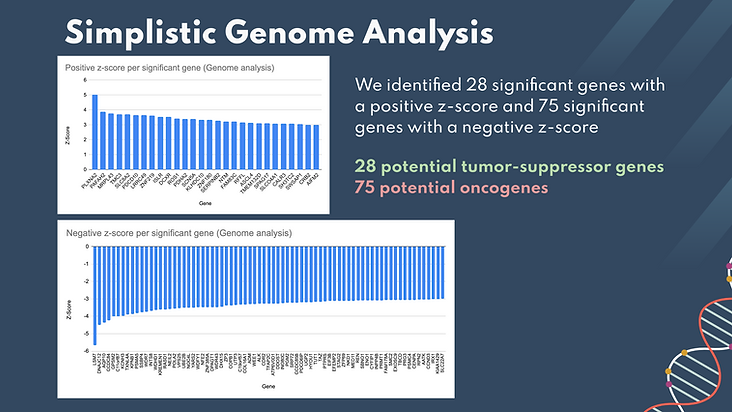
We started by performing simplistic analysis on the data obtained from HeLa cells. The significant genes were extracted from the sheet with a true/false function to determine whether their z-scores were less than -3 or more than 3. We then created these histograms showing all of the positively and negatively significant genes, ordered based on their z-scores. We identified 28 positively significant genes as potential tumor suppressors, the most significant being the PLXNA2 gene.We identified 75 negatively significant genes as potential oncogene targets, the most significant being the LSM7 gene.

The histogram in the upper left shows the frequency of z scores across all kinome genes screened in the simplistic analysis. Names and z-scores of all genes with (|z| > 3) are listed in the chart below. In total, there were 26 statistically significant genes identified in the MDAMB231 Kinome screen. These hits all had significantly negative z scores, indicating that these genes significantly reduced growth.
The plot to the right illustrates this: significant genes, highlighted in red, show lower fold change than expected on day 14. This was determined by plotting fold change across the entire set of genes.
These results show that knockouts of the identified genes cause slower growth, indicating the gene hits found on the kinome screen are potential oncogenes.
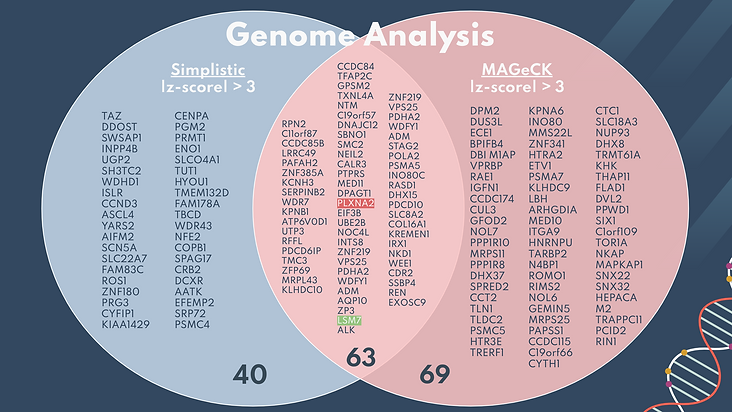
A Venn diagram was created to compare the results of significant genes obtained from the simplistic genome analysis and the MAGeCK genome analysis. Both forms of statistical analysis had a z-score cutoff of greater than 3 or less than -3. The MAGeCK data went through 2 filters, where the genes were first screened using the p-value of less than 0.05 and then the absolute z-score of above 3.
37% of the total genes overlapped, including the most positively and negatively significant hits, as shown in green and red (PLXNA2 and LSM7). This shows that although there were differences between the two types of analysis, there was still a relevant overlap of significant genes. The genes selected as potential therapeutic targets were picked from the region of overlap, since they have two statistical methods to prove their biological relevance.

Another Venn diagram was made to find similarities between the results found from the simplistic kinome analysis and the MAGeCK kinome analysis. Similar to the last slide, the significant genes were selected using an absolute z-score of above 3. 75% of the genes overlapped, and these were all negatively significant hits. This shows that both analysis methods were able to pinpoint potential oncogenes. RFK and AURKA were significant in the MAGeCK analysis using z-score but did not pass the p-value test.
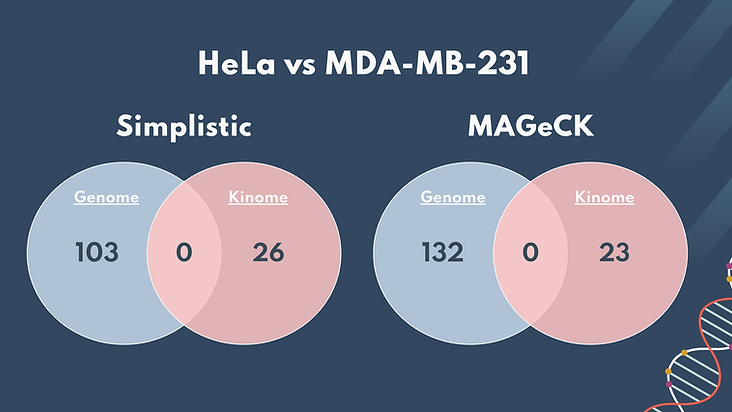
Additionally, we compared the significant genes present in the HeLa (Genome) cells to the MDA (Kinome) cells. As seen above, there is no overlap of significant genes between the datasets. We concluded that when making a drug that targets cancer growth, we must make it specific to the type of cancer, whether it be breast cancer or cervical cancer. It is less feasible to create a targeting system that can be applied universally to different cancers.
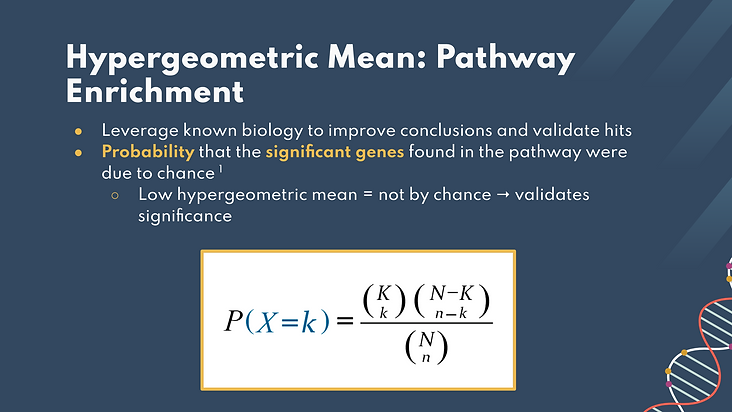
To quantitatively analyze whether there were any full cell signaling pathways that were potentially significantly impacted in our work, we developed a hypergeometric mean analysis. The hypergeometric mean was used to calculate the likelihood that the pathway in question significantly impacted the phenotype. The hypergeometric mean describes the probability that the significant genes in the pathway were due to chance, so a low hypergeometric mean means higher significance of the pathway.
We used the equation below to calculate this mean, where the uppercase K is the total number of significant genes, the lowercase k is the number of significant genes that belong to the desired pathway, uppercase N is the total number of genes, and lowercase n is the number of genes known to belong to the desired pathway.
Though our mathematical model identified many significantly impacted pathways, we chose three significant pathways to elaborate on. We found these by putting the list of significant genes into Reactome.com to get which pathways they were involved in. From there, we cross–checked the p–values of these pathways output by the MAGeCK algorithm to ensure that they were significantly perturbed. The p–values for each of these pathways was close to zero, indicating that they experienced a notable change.
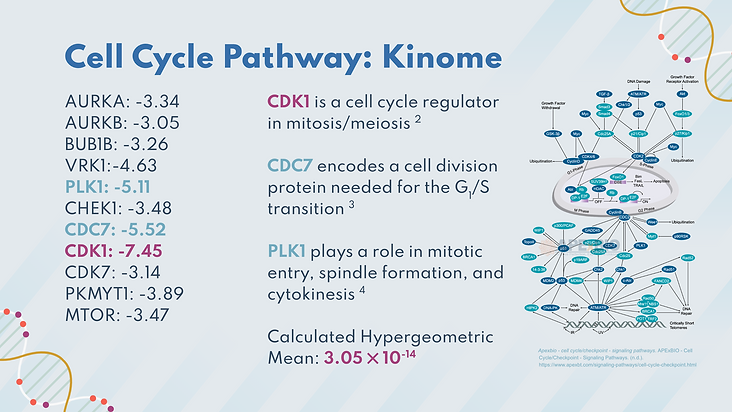
The first of these pathways was the cell cycle, which controls the cell’s growth from the growth stages to mitosis. When this pathway gets disrupted, unwarranted cell division can occur, which can lead to cancer. 11 significant genes were involved in the pathway, including CDK1. CDK1 is a cell cycle regulator that ensures that there is no damage in the cell before it progresses to the next stage. The hypergeometric mean is 3.05 x 10^-14 which indicates that the significant genes found in this pathway were not due to chance, and contributed to the pathway being disrupted.
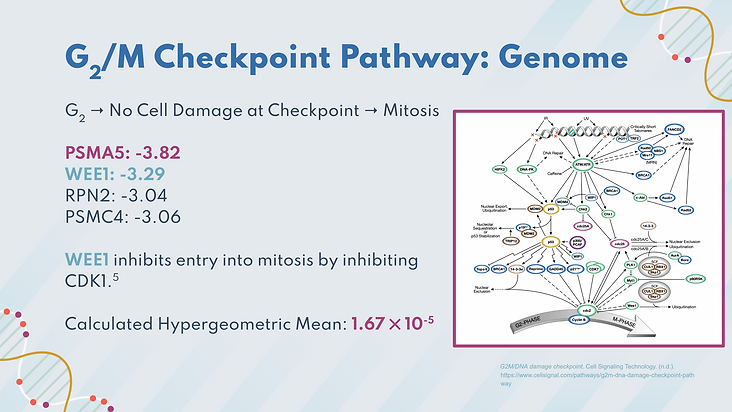
The next chosen pathway was the G2/M checkpoint pathway, which controls the cell’s growth from the G2 phase to mitosis. When this pathway gets disrupted, unwarranted cell division can occur, which can lead to cancer. 4 significant genes were involved in the pathway, including WEE1. WEE1 is a cell cycle regulator that inhibits entry into mitosis by inhibiting CDK1. The hypergeometric mean for this pathway was found to be 1.67 x 10^-5, which indicates that the significant genes found in this pathway were not due to chance, and likely contributed to the pathway being disrupted.

The final pathway we will discuss is p53 signaling pathway controls the cell apoptosis if there are damaged proteins in the cell. This pathway is commonly targeted when observing or developing treatments for various cancers. When this pathway gets disrupted, cells with significant damage will continue to proliferate instead of going through apoptosis. 4 significant genes were involved in the pathway, including PSMA5. PSMA5 codes for a protease that targets damaged proteins. The hypergeometric mean is 1.33 x 10^-4 which indicates that the significant genes found in this pathway were not due to random chance, and contributed to the pathway being disrupted.

Since no genes overlapped between the HeLa and MDA cells, we must target separate genes to the specific cancer type when creating gene therapy drugs. Many genes overlap between simplistic and Magic analysis, which shows that although Magic is more comprehensive, using a simplistic analysis model provides very similar results. By pinpointing which genes are the most significant in cancer growth, we can create drugs that knock out those genes, and thus treat cancer. Some genes we are thinking of knocking out are CDK1, CDC7, PSMA5, and WEE1. We can also make personalized medicine by running screens on individuals, to make drugs that target specific genes that are mutated in their genome.

There are a variety of gene therapy drugs already on the market and in clinical trials that fight against cancer. This includes Dinaciclib, which is a CDK inhibitor capable of inhibiting CDK1, in addition to other CDK genes/proteins. Dinaciclib has demonstrated tumor growth-inhibition both in vitro and in vivo. Its mechanism of action has been observed to be a direct inhibition of CDK-mediated phosphorylation, which initiates mitosis. This drug is not yet fully FDA-approved but has proven effective in mice in pre-clinical trials.
PSMA5 is a gene that encodes the proteasome alpha 5 subunit protein that contributes to the formation of the 20S Proteasome, which digests damaged proteins within cells. Currently, there is an FDA approved drug in the market called Velcade, which is a proteasome inhibitor. This drug reversibly binds to the subunit of the 26S proteasome, resulting in its inhibition and preventing the degradation of pro-apoptotic factors. The accumulation will eventually activate the programmed cell death which can promote the destruction of cancer cells. While recent studies show a correlation between Velcade and PSMA5 function, this drug is made to target the 26S Proteasome as opposed to the 20S.
AZD-1775 is a drug which has been shown to enhance the cytotoxicity of chemotherapy and radiation agents by inhibiting WEE1 and overriding G2/M pathway checkpoints to allow the progressive accumulation of DNA damages without repair, resulting in apoptosis
Polo-like Kinase 1 (called PLK1) is overexpressed in many cancers and is one of the genes with the highest Z-scores in the cell cycle pathway for our Kinome analysis. PLK1 is a serine/threonine protein kinase that plays major roles in controlling mitotic entry and coordination of the centrosome and spindle assembly. It also is essential for repairing DNA damage, and if PLK1 is inhibited it may prove to be a potential target for many cancers. The most advanced one so far is called Onvansertib which selectively inhibits PLK1 and causes less DNA repair, which may prevent cancerous cells from forming. It’s currently going through Phase 2 trials.
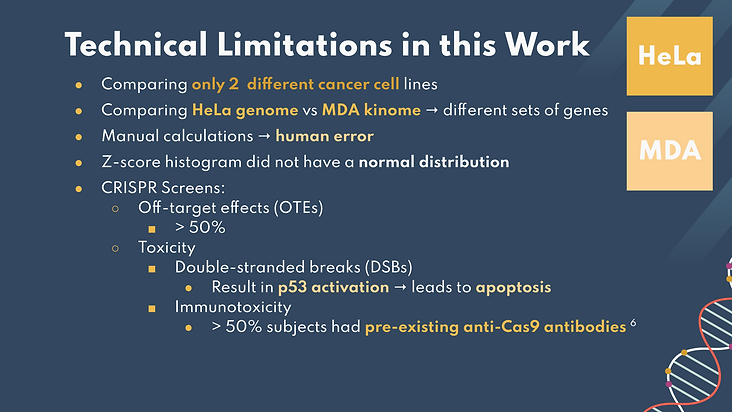
Though this experiment gave a vast amount of useful data, there were still some technical limitations. We only compared cancerous cell lines, HeLa and MDA, no healthy cell lines. Different types of cancers must also be analyzed and compared for a more comprehensive view on which genes are involved in cancer. Additionally, extrinsic errors can result from a low sampling frequency, for instance only measuring counts on day 3 and day 14.
Another limitation is that the HeLa genome was compared to the MDA kinome. Ideally, we would compare the same set of genes in both cells for more accurate or biologically relevant results. The z-score histogram did not have a true normal distribution because although there is a general bell curve shape, the left tail tells us that we would need to add more samples. Furthermore, we performed the calculations manually, which could result in human error.
General technical limitations of CRISPR screens include inaccuracies due to experimental noise. Intrinsic errors include potential off-target effects which occur when Cas9 proteins act on non-targeted sites and have been observed at a frequency of over 50%. Another limitation of the CRISPR-Cas9 complex is toxicity, including CRISPR-induced double-stranded breaks which can trigger p53 activation and thus lead to apoptosis. Finally, immunotoxicity is a problem as a study found that over 50% of subjects already had pre-existing anti-Cas9 antibodies.
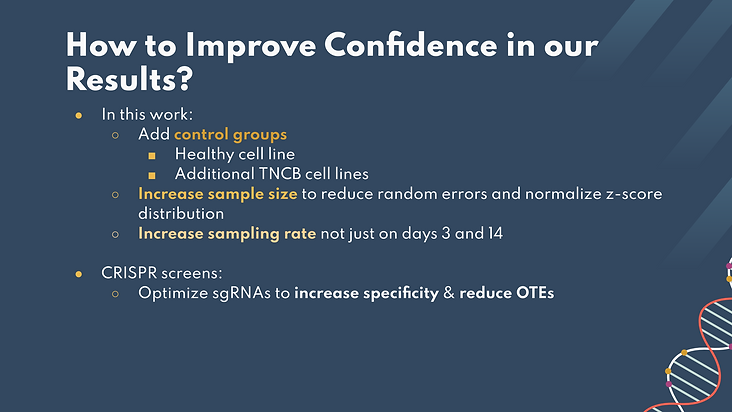
In the future, we can take steps in our experiments to improve results. We can add a control group, which could be a healthy cell line. To reduce noise, we used an average of 3 replicates per gene, but adding more could further confirm our findings. We could also increase the sampling rate (sampling every third day or even every other day instead of just day 3 and day 14) and increase the sample size to reduce random errors and noise.
In order to optimize CRISPR screens, more attention can be brought to the process of making the sgRNAs by increasing their specificity and thus reducing the frequency of off-target effects.
We can use CRISPR in the future to design and implement novel experiments, like the one we performed for this presentation. CRISPR can be used in implementing novel experiments with varying, distinct parameters such as hormones, factors (GFs), etc. available to the cells in media, the presence of drugs to treat cancers or diseases, and gradient concentrations of molecules. CRISPR technology can be used in developing personalized treatments for cancer and disease patients.
Also, this morning (12/08), the FDA approved the first CRISPR-based medicine for treating sickle cell disease, called Casgevy and developed by Vertex Pharmaceuticals and CRISPR Therapeutics.